Publication | Beyond a Path 2: Trail Planning
Publication | Beyond a Path 2: Trail Planning
HOW TO GET STARTED
There are two general ways to begin a trail project in a community. The first method is for the community (client) to hire design or planning professionals such as landscape architects, urban planners or engineers to lead a trail project on behalf of the community. The second way involves a grass roots approach where a community gets the project started and develops the conceptual ideas on their own and then later brings in professionals during the design phase. Regardless of the approach for the initial phase, professionals need to be involved to eventually construct the trail(s) but how much of the process and outcome they influence is ultimately up to the community. For the purpose of this document, we will focus on the second method to help projects get started in the community by the community. Collaboration, coordination and partnerships are essential for the success of a project due to the linearity of trails and complexity of trail systems. The specific outcomes of a trail, its benefits, and costs for the community depend on the specific location, region and potential of the community group as covered in the Beyond a Path 1 publication.
Now that the community is ready to move beyond the concept and goals phase certain steps should be considered. An inventory of existing physical, cultural, and socio-economic conditions in and around the project area will help inform potential for and suitability of trail routes to community members and professionals throughout the decision making and design process. To save time and effort, it is often efficient to rely on existing conditions and historical information to identify and envision the type of trail and the approximate route that would be most suitable and feasible for the community and its context.
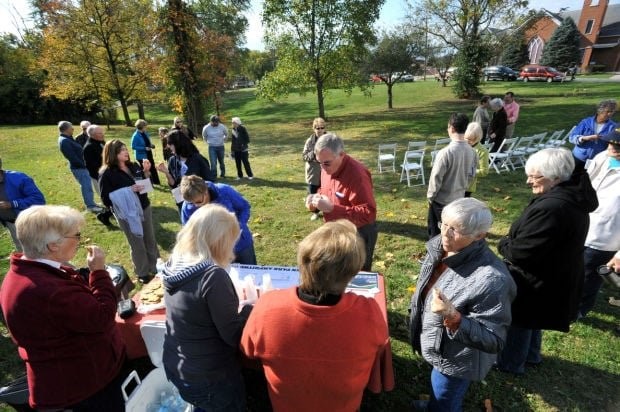
For the route itself, there are various factors to consider when planning and designing trail projects. Trails should connect points of interest in the community; therefore, trail projects most likely will stretch beyond individual properties. Depending on the length of a trail, numerous property owners who are affected directly may need to be consulted. In addition, the public, stakeholders and partners must all be involved to build a trail that will be valued and used.
The major goal of a trail project is to plan, create and implement a path or system of trails that will be effectively used by the entire community. It is important to consider and plan routes to connect to points of interest or destinations that can expand beyond addressing recreation, travel or health goals. For example, a trail that clearly connects the center of activities in downtown to a public space or park will be used more than a route that just connects to the edge of downtown without a widely used path between the edge of downtown and the center of activities. Here, the term downtown is loosely used as the major part of one’s community where people regularly stop by or visit for everyday activities or errands (Figure 1).
Figure 1. Trailhead/Destination and the Trail Route
- Point A: Trailhead, starting or ending location outside of the community
- Route: Path between destinations/trailheads
- Point B: Trailhead, destination or starting location in the community
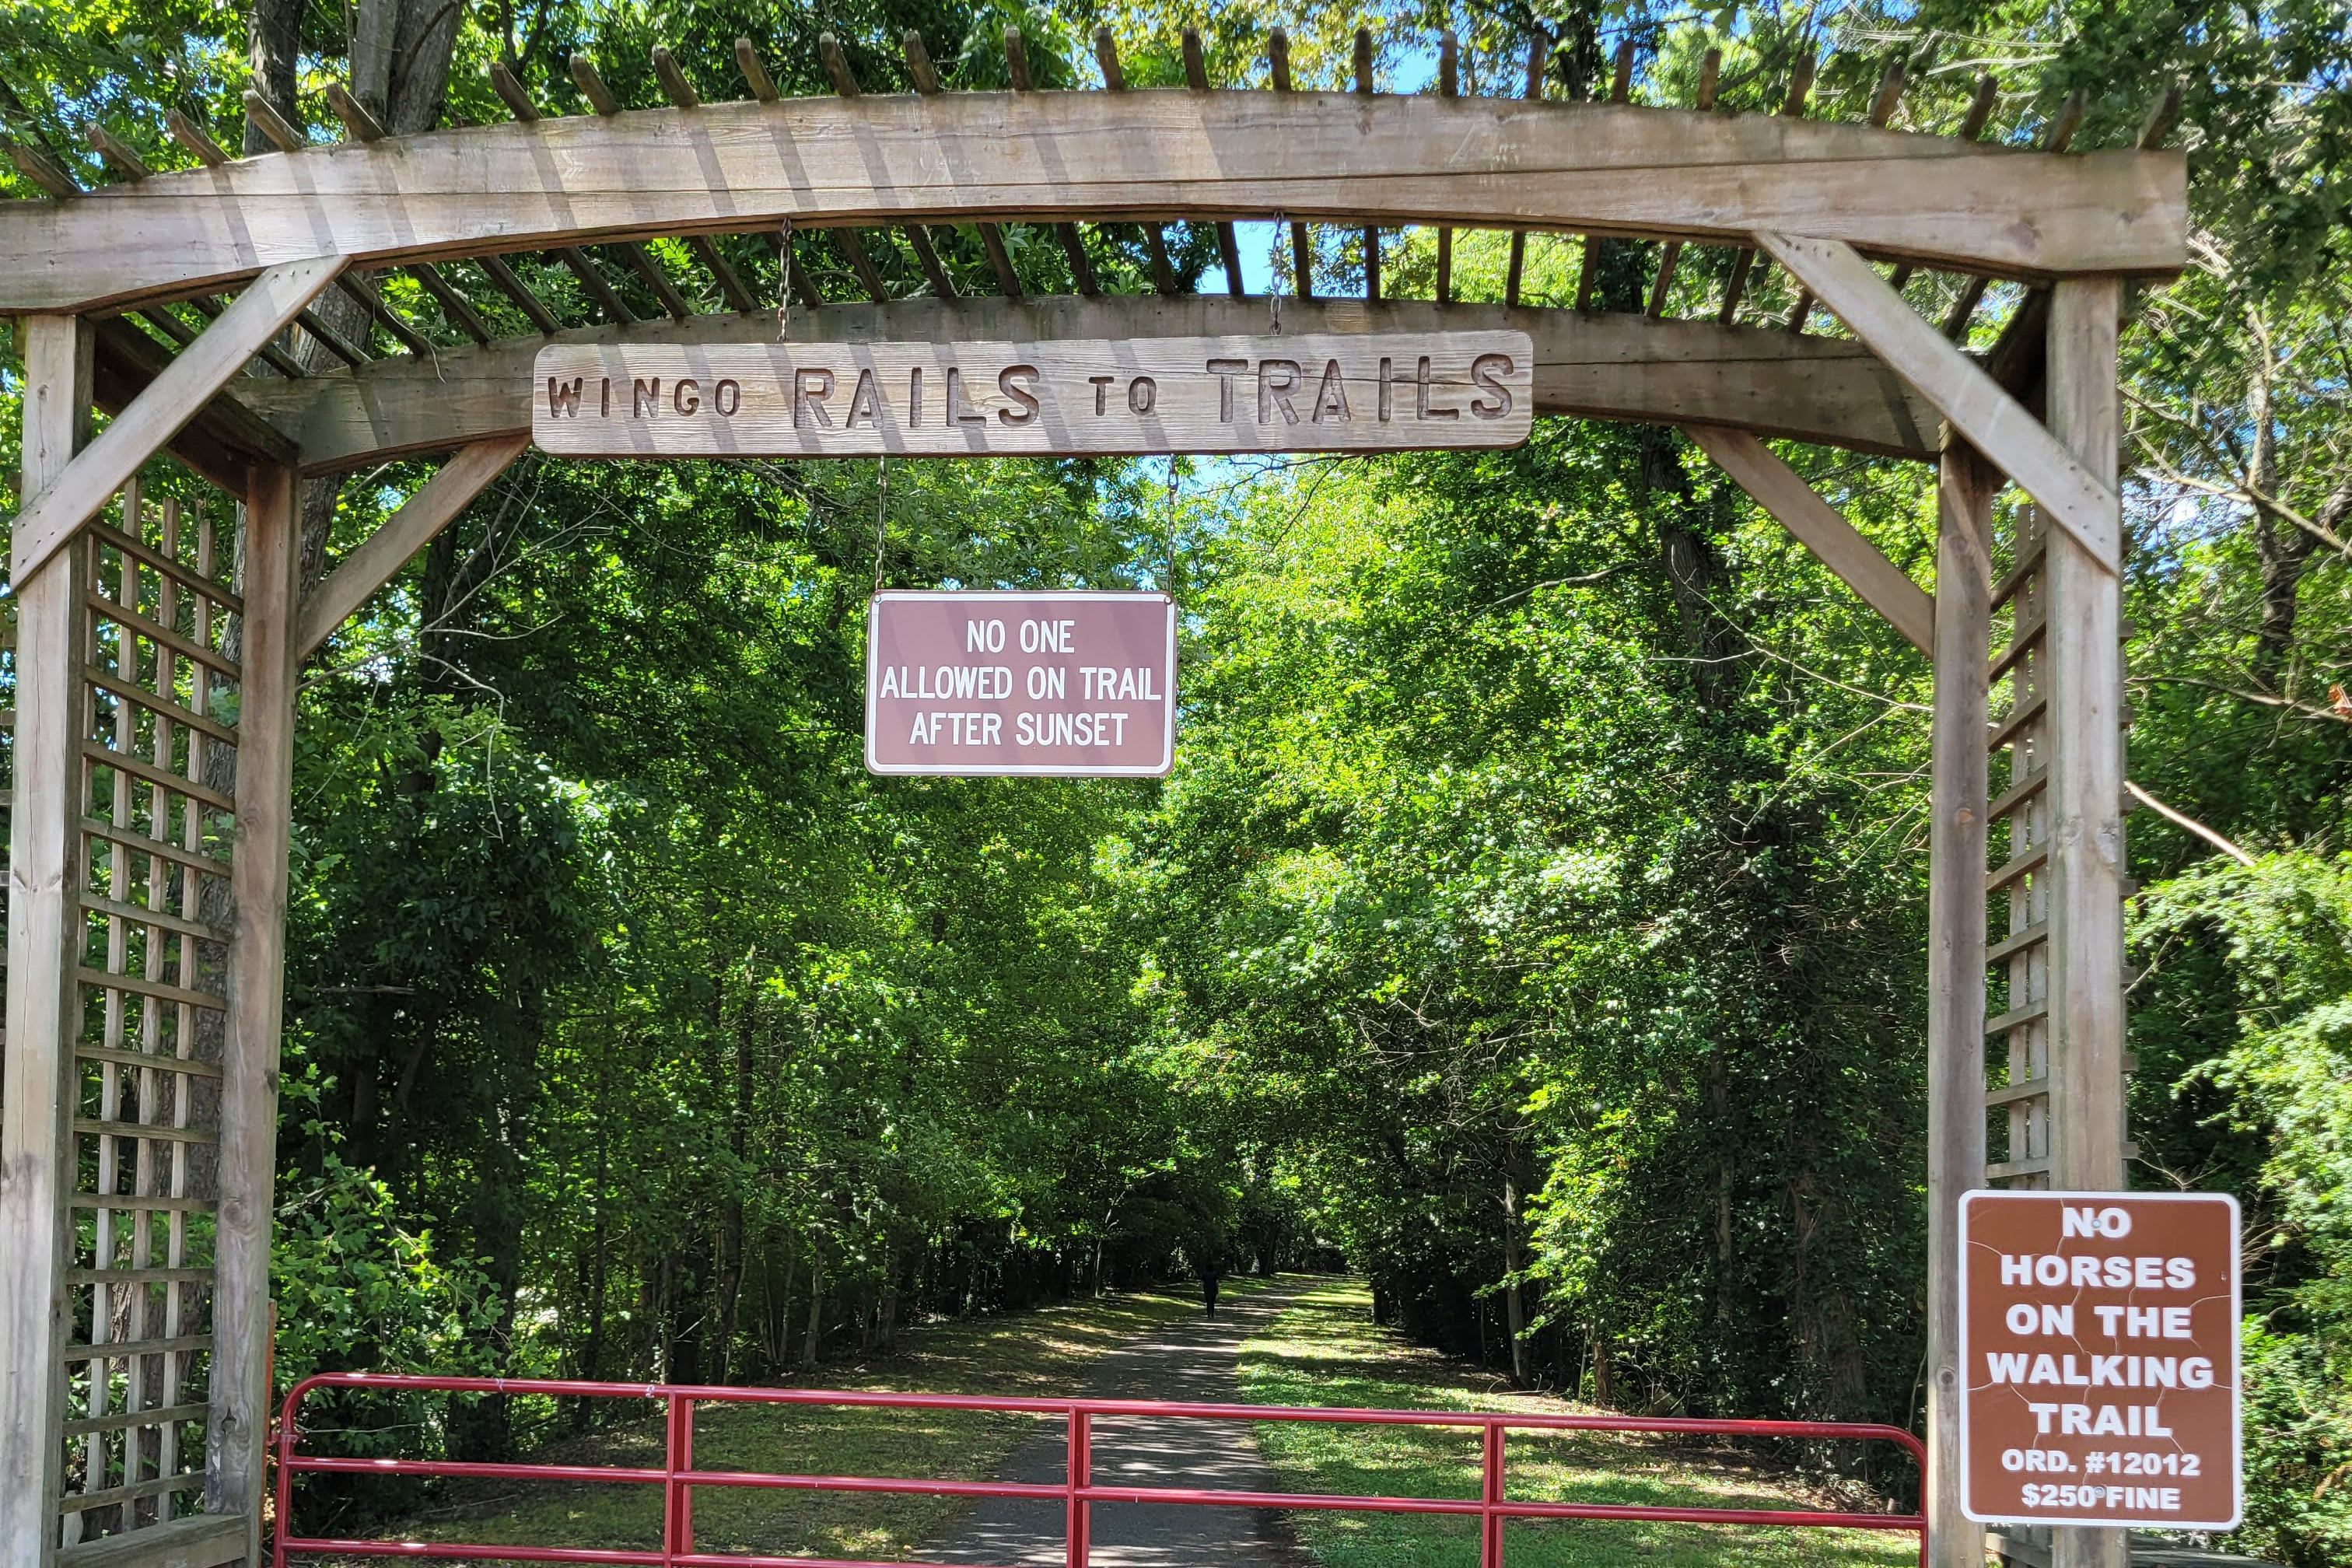
Additionally, trailheads/destinations or starting and ending points for the trail should be pleasant and welcoming for both community members and visitors by being clearly visible and marked throughout town. Typically, signs will indicate the trail along with maps that depict the trail’s route and relevant services for users, such as accommodations or rest areas, that should be available to support positive experiences.
INVENTORY
Once a working group sets the project goal(s), the key leaders need to gather information for the project area and identify potential destination points and route(s), trailhead(s) locations and contents for an effective plan and informed design. During this fundamental phase, community leaders, extension agents, volunteers and partners need to seek, identify, and inventory a range of data that will inform the decision makers of potential routes and intended uses for the proposed trail(s). Much of the necessary information is readily available at relevant offices in the local community such as the County or City Office of Planning and Zoning, Fiscal Court, historical societies, public libraries or community newspapers as well as from individuals. Relevant qualitative and quantitative information can also be obtained from various regional and state-wide offices, agencies, departments, organizations, and research institutions such as the University of Kentucky. The types of information needed can be classified into the following categories: biological/physical, social/economic and historical/cultural (Table 1).
Table 1. Examples of Information and Data for Trail Projects
BIOLOGICAL/PHYSICAL
- Maps of project location, restrictions, land parcels
- Existing and non-existing natural resources
- Climate factors
- Physical condition of spaces and places
- Conservation/preservation/ development opportunities
- Signs of deterioration
SOCIAL/ECONOMIC
- Demographics of the community, county, region
- Economic indicators of the community, county, region
- Planning documents
- Types and numbers of industries
- Regulations, standards for cities and counties
- Surveys (census, business activities, economic performances)
HISTORICAL/CULTURAL
- Historical maps, photos, documentation
- Community programs, regular or irregular events
- Recreational opportunities
- Landmarks, preserved elements
- Valued spaces, places, locations
- Activity trends
This information ranges from topography, soil data, demographics, comprehensive plans, zoning maps and ordinances, and property boundaries to photographs, journals, news articles and so on. Once the relevant information is collected, the working group will better understand the opportunities/potentials and the constraints/limitations of a particular trail project.
BIOLOGICAL AND PHYSICAL INFORMATION
Biological and physical information includes data on natural resources, human influenced features, and infrastructure that can either be historical or currently existing in the community. Contents include topography, hydrology, wildlife species, reserves and preserves, geology, and water quality among others as well as built environment information such as roads, railroad tracks, and watersewer systems (Table 2, Figures 2 and 3).
Table 2. Endangered or Threatened Species, Bullitt County, Kentucky.
This table lists the status of sensitive plants, animals and their habitat that should be considered during development activities. Source. Kentucky State Nature Preserves Commission, 2014.
| Taxonomic Group | Name | Status/Rank | # of Occurences | ||||
| Freshwater Mussels | Villosa lienosa, "Little Spectaclecase" | S/, G5 / S3S4 | 1-E | 0-H | 0-F | 0-X | 0-U |
| Crustaceans | Orconectes jeffersoni, "Louisville Crayfish" | E / SOMC, G1 / S1 | 2-E | 0-H | 0-F | 0-X | 0-U |
| Fishes | Noturus stigmosus, "Northern Madtom" | S / SOMC, G3 / S2S3 | 2-E | 1-H | 0-F | 0-X | 0-U |
| Reptiles | Clonophis kirtlandii, "Kirtland's Snake" | T / SOMC, G2 / S2 | 1-E | 0-H | 0-F | 0-X | 0-U |
| Breeding Birds | Chondestes grammacus, "Lark Sparrow" | T /, G5 / S2S3B | 0-E | 1-H | 0-F | 0-X | 0-U |
| Nyctanassa violacea, "Yellow-crowned Night-heron" | T /, G5 / S2B | 1-E | 0-H | 0-F | 0-X | 0-U | |
| Mammals | Myotis grisescens, "Gray Myotis" | T / LE, G3 / S2 | 0-E | 1-H | 0-F | 0-X | 0-U |
| Mammals | Myotis septentrionalis, "Northern Long-Eared Bat" | E / PE, G2G3 / S3 | 1-E | 0-H | 0-F | 0-X | 0-U |
| Mammals | Myotis sodalis, "Indiana Bat" | E / LE, G2 / S1S2 | 4-E | 0-H | 0-F | 1-X | 0-U |
| Mammals | Nycticeius humeralis, "Evening Bat" | S /, G5 / S3 | 5-E | 0-H | 0-F | 0-X | 0-U |
| Communities | Dolomite glade | E /, GNR / S1 | 3-E | 0-H | 0-F | 1-X | 0-U |
| Communities | Limestone barrens (open woodland) | T /, GNR / S2 | 1-E | 0-H | 0-F | 0-X | 0-U |
| Communities | Limestone slope glade | S /, GNR / S2S3 | 1-E | 0-H | 0-F | 0-X | 0-U |
| Communities | Limestone/dolomite prairie | E /, GNR / S1 | 1-E | 0-H | 0-F | 0-X | 0-U |
Figure 2. Shaded Relief Map of Bullitt County, Kentucky.
This map depicts topography that can be used to aid in determining the potential suitability or unsuitability of potential trail routes. Data Source: KY Geoportal, 2014.
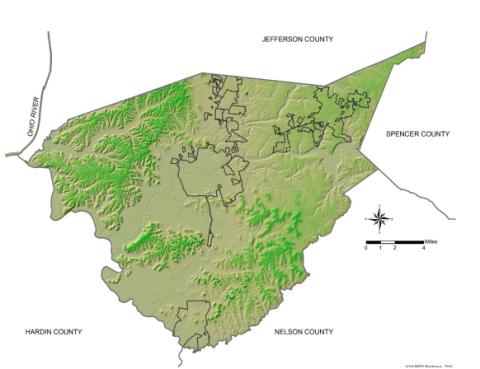
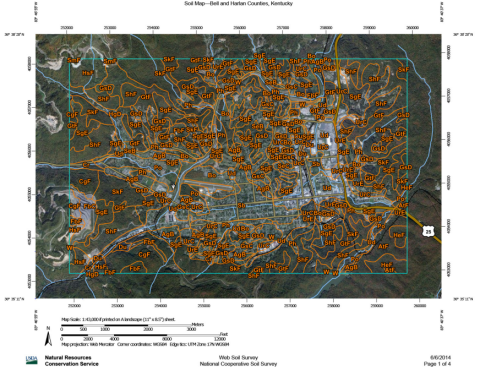
Figure 3. Soil Map of Middlesboro, Kentucky.
This map illustrates locations of sandy loam to clay structures that may restrict certain development activities. Source: USDA, NRCS, 2014.
These biological/physical infrastructure data are publicly available and accessible through local, regional, state and federal level public offices and entities such as the Kentucky Energy and Environment Cabinet, Kentucky Transportation Cabinet, US Department of Agriculture, and US Geological Survey among others. Typically, the information is in the form of maps, aerial images, reports, or other documents and lists that support decision making phases. Biological/Physical data inform us whether certain sites, locations or properties are suitable or problematic to support trails. Trails should avoid certain areas such as sensitive habitat (Table 2), major arterial roads, railroads, and steep slopes. Trails may cross streams or flood prone zones but there are other safety concerns to consider when proposing such routes. Overall, this type of data informs us about where biotic or abiotic resources physically exist or do not exist and directly affect the potential plans of trail route(s).
SOCIAL AND ECONOMIC DATA
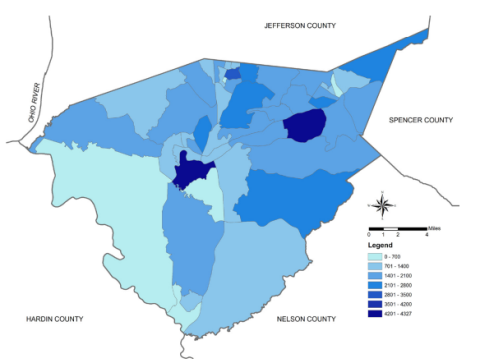
Social and economic data inform us about people and households such as changes in demographics, trends in economic performance, development activities and land use decisions. Factors such as distribution of population, associated income, housing occupancy and economic performance indicators are just some examples of this type of data (Figure 4).
Figure 4. 2010 Population Map of Bullitt County, Kentucky, at Blockgroup Level.
Data Source: KY Geoportal, 2014.
Social/economic information can be found through sources such as the US Census Bureau, Kentucky State Data Center and Kentucky Geography Network. Information from these sources enables effective interpretation of the potential success of the community trail(s), user forecast and other indirect economic activities that can be generated or strengthened. Additionally, local level data can be found in reports and documents available through community and economic development organizations or research groups (Figure 5).
Figure 5. Local Economy Pull Factors by Retail Subsectors, Bell County, Kentucky.
Source: Woods and Poole, 2010 in CEDIK (now Blueprint Kentucky), 2012.
Retail Subsector |
Rank |
Share of total Retail |
Change in Sales 2002-2010 |
KY Pull Factor |
Cumberland Valley ADD Pull Factor |
County Pull Factor |
All Subsectors |
- | 100% | -5.4% | 3.18 | 1.18 | 1.53 |
General Merchandise Stores |
1 | 34.4% | 1.3% | 1.42 | 1.38 | 2.84 |
Food & Beverages |
2 | 17.9% | -4.2% | 1.01 | 1.26 | 2.17 |
Motor Vehicles & Parts Dealers |
3 | 12% | -32.9% | 0.99 | 1.14 | 1.18 |
Eating & Dining |
4 | 9.7% | 3.6% | 1.07 | 0.92 | 1.44 |
Health & Personal Care Stores |
5 | 6.3% | 7.3% | 1.25 | 1.26 | 1.43 |
Gasoline Stations |
6 | 5.5% | 23.4% | 1.53 | 1.54 | 0.62 |
Building Materials & Gardening Stores |
7 | 5.2% | -4.1% | 1.23 | 0.97 | 0.95 |
Clothing Stores |
8 | 3.3% | -7.3% | 0.79 | 0.85 | 1.40 |
Miscellaneous |
9 | 2.9% | -16.9% | 1.29 | 1.25 | 1.55 |
Non-Store Retail |
10 | 1.1% | 13.9% | 0.53 | 0.58 | 0.55 |
Furniture Stores |
11 | .9% | -19.6% | 0.90 | 0.93 | 0.67 |
Sporting Goods |
12 | .8% | -15.8% | 0.79 | 0.54 | 0.90 |
Electronics & Appliances |
13 | .1% | -4% | 0.73 | 0.37 | 0.11 |
HISTORICAL AND CULTURAL INFORMATION
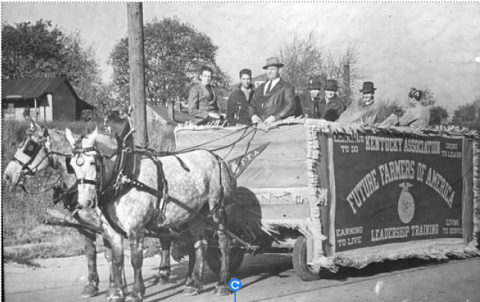
Historical and cultural resources provide background information related to communities concerning what has changed and how or what has remained. Valuable resources such as historic buildings, photos of events and festivals, and excerpts from journals provide detailed information that may not be available through other sources. Events or places that might seem unimportant to some members of the community, such as locations of demolished buildings, heritage trees, or cultural activities, can add depth to the community project analysis or design (Figures 6 and 7).
Figure 6. A Sanborn Insurance Map of Lexington, Kentucky, 1901.
Source: Kentucky Digital Library, 2007.
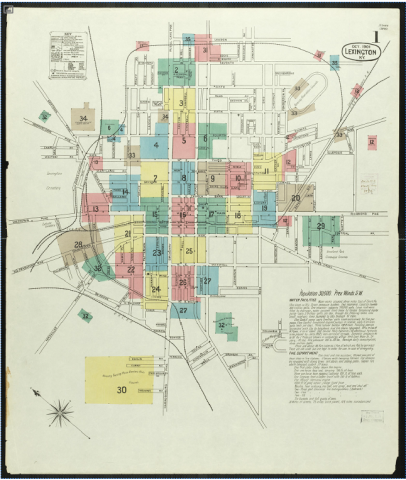
Figure 7. Future Farmers of America Float in Tobacco Parade, Lexington, Kentucky, 1939.
Source: Kentucky Digital Library, 2013.
Furthermore, although some information may seem personal to a certain degree, it actually provides a sense of identity for the community. Therefore, these qualitative types of resources can indicate assets as well as strengths, and weaknesses of the community and put it in a physical and temporal context.
ANALYSIS
Information for the planning and design of potential trail projects can highlight important assets a community already has or would like to reinstate. An analysis enables the working group to further understand how the com-munity has changed physically, socially and culturally. Similarly it can help the group understand how the community has not changed which can be just as important. The analysis process will better prepare the working group to address the future needs of their community. Once all relevant and available information is gathered and missing information is identified, the working group will be able to analyze opportunities and constraints for the proposed trail project. An effective analysis can lead to the identification of potential uses for the trail as well as how the project can be effectively and efficiently implemented. Inventoried data such as traffic flow, pedestrian circulation, building usages, wildlife habitat, and geological surveys can together help identify opportunities or constraints for a trail route proposal (Figures 8, 9, and 10).
Figure 8. Bullitt County Analysis Map, conceptual.
Source: UKLA Student Work
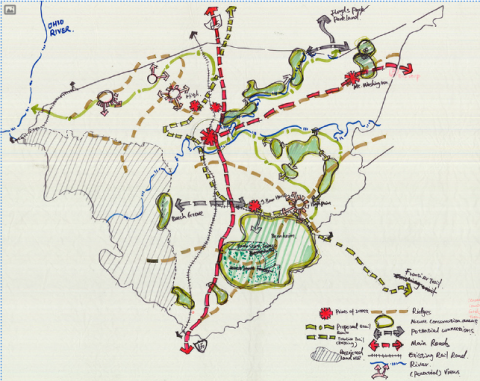
figure 9. Bullitt County Analysis Map, detail.
Source: UKLA Student Work
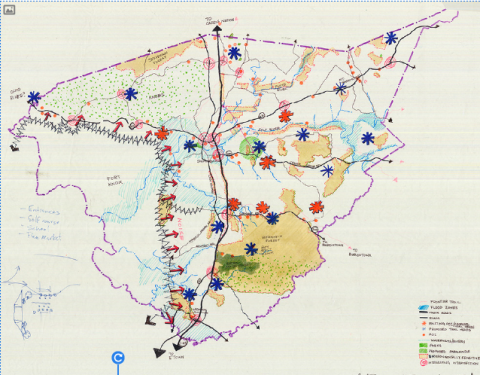
Figure 10. Proposed Trail Alternatives in Central Bullitt County.
Data Source: KY Geoportal, 2014.
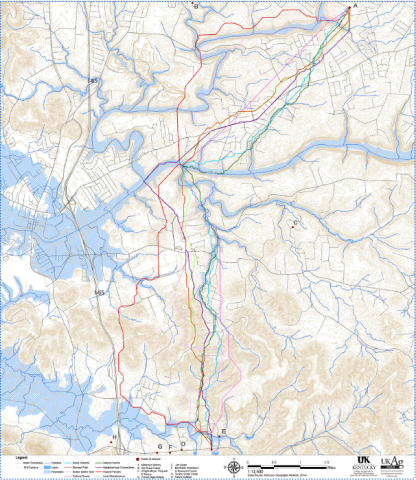
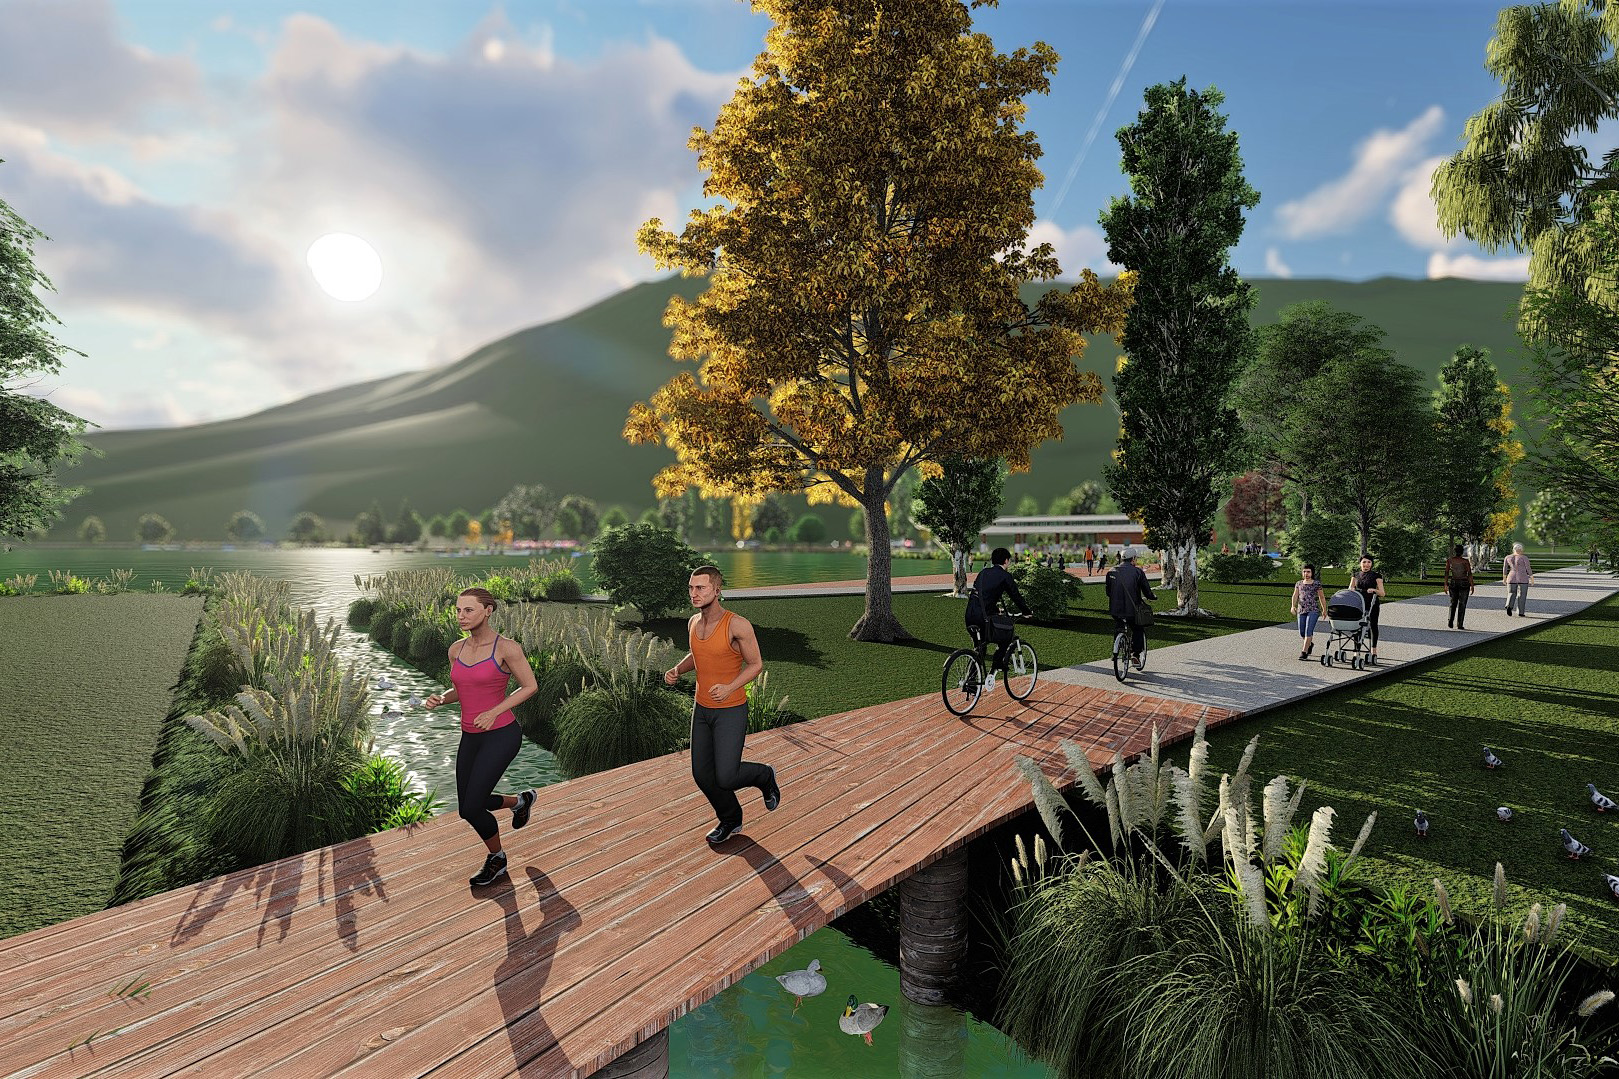
Through the analysis, stakeholders have the opportunity to make connections and proposals regarding the route and the surrounding context, as well as participate in meaningful decisions for the extended community. A thorough analysis can lead to a more effective trail plan or design that is more likely to be used regularly by humans and wildlife, and become a destination in its own right for residents and visitors.
REFERENCES
Kentucky Digital Library. (2007). Insurance maps of Lexington, Kentucky. University of Kentucky Repository. Retrieved from http://kdl.kyvl.org/catalog/xt766t0gtp1k_2
Kentucky Digital Library. (2013). “Future Farmers of America (F.F.A). float” University of Kentucky Repository. Barker and Faulconer Fayette County Public Education photographs. Retrieved from http://kdl.kyvl.org/catalog/xt7nk931368m_25_70
Kentucky Geography Network. (2014). KY Geoportal. Retrieved from http://kygisserver.ky.gov/geoportal/catalog/main/home.page
Kentucky State Nature Preserves Commission. (August, 2014). County Reports of Monitored Species & Natural Communities. Retrieved from http://naturepreserves.ky.gov/pubs/Pages/cntyreport.aspx
University of Kentucky, Community and Economic Development Initiative of Kentukcy (CEDIK, now Blueprint Kentucky). (2012). Kentucky County Retail Sector Profiles: Bell County. Retrieved from http://cedik.ca.uky.edu/data_profiles/retail_sector
USDA, Natural Resource Conservation Service (NRCS). (2014). Web Soil Survey: National Cooperative Soil Survey. Retrieved from http://websoilsurvey.sc.egov.usda.gov/App/HomePage.htm
Related Information