Publication | Walkability and Connectivity Assessing and Planning for Healthier Community Environments
Publication | Walkability and Connectivity Assessing and Planning for Healthier Community Environments
INTRODUCTION
Built environment patterns are essential for supporting the pedestrian experience in communities. Since the mid-twentieth century, the intertwined relationship between sprawling development patterns and auto dependence has left many communities with built environments that discourage people from walking in the community. With the shifting focus on people rather than cars, attention and interest in planning and design has brought about the need to bring back walkable communities to attain various goals and objectives including pursuing healthier lifestyles, engaging in more physical activities, and investing in attractive pedestrian focused environments.
Many communities have turned their efforts toward reintroducing and strengthening their pedestrian paths/ networks and increasing connectivity in the community. Supportive built environment patterns can have other impacts on people’s everyday lives and lifestyles by providing a safe and attractive environment for outdoor activities. Sound and well-connected walkable environments can also directly influence a community’s economic health, place identity, and sense of community.
The goal for this document is to present and describe steps for assessing a built environment and to guide community groups on how to enhance their community’s walkability. Relevant for large to small communities, it illustrates how a community can initiate a walkability and connectivity project to address community needs and visions. Trained volunteers can use the document to identify, assess, and develop actionable plans relevant for their community’s needs.
STEP ONE. IDENTIFY AND PLAN GOALS AND OBJECTIVES FOR THE COMMUNITY PROJECT
A proactive community can discuss and set goals and objectives for improving their built environment that would be supportive of walking and biking activities for everyday errands, recreation, commuting, or health goals. By addressing walkability or connectivity needs, a community can resolve other needs and visions of the community as a whole (Table 1).
Table 1. Example of goals and objectives of walkability and connectivity community projects
WALKABILITY
Goals
- Improve quality of life and health
- Establish environment for alternative transportation users including pedestrians, bicyclists, and public transit riders
Objectives
- Improve and establish sidewalks to be usable for all community members, regardless of ability
- Enhance and increase street amenities (vegetation, signage system, street furniture, etc.)
- Increase pedestrian safety through traffic calming strategies
- Reflect and/or apply Complete Streets principles
- Update and upkeep attractive building facades facing the public right-of-way
Outcomes
- Increased level of foot traffic, pedestrian safety and outdoor activities
- Enhanced individual and community health and wellness
- Enhanced built environment quality and aesthetics
CONNECTIVITY
Goals
- Increase and expand network of sidewalks and/or bike lanes
- Aim for a fully connected network
Objectives
- Identify gaps in the network to efficiently link existing infrastructure such as sidewalks and/or bike lanes
- Increase accessible areas and destinations by improving sidewalk networks
- Enhance pedestrian experience with appropriate amenities to address safety concerns
- Address infrastructure needs for wider user demographics and physical abilities
Outcomes
Longer sidewalk segments and routes connected for safe and pleasant travel
Increased number of destinations accessible by pedestrians and bicycles
By understanding the underlying direct and indirect causes and effects, a community can use a walkability or connectivity project to bring about a range of solutions as outcomes. However, it is essential for the community working group to clearly identify and define the goals and objectives of their project.
STEP TWO. CHOOSE AND CONDUCT A WALKABILITY ASSESSMENT OR AUDIT FOR YOUR BUILT ENVIRONMENT
Numerous walkability assessment tools exist which can be used to survey and analyze a community’s existing built environment conditions and ultimately transfer findings into actionable plans to improve the walking environment (Figure 1).
Figure 1a. Walkability assessment tools by Pedestrian and Bicycle Information Center (PBIC)
Source: Pedestrian and Bicycle Information Center; used by permission

Figure 1b. Pedestrian Environment Data Scan (PEDS)
Source: Kelly J. Clifton, National Center for Smart Growth; used by permission

Each survey instrument approaches assessing walkability in both similar and different ways depending on the developers’ intentions. Some tools are simple and concise while others are lengthy and detailed. The specifics of questions may differ from objective to subjective, but the results often provide similar interpretations that could result in similar diagnoses and prescriptions for actionable strategies (Table 2).
Table 2. Examples of walkability assessment tools
Sources: Pedestrian and Bicycle Information Center; Clifton, Livi, and Rodriguez; CDC
WALKABLE COMMUNITY
Author/Organization: Originally by Partner for Walkable America housed in Pedestrian and Bicycle Information Center
Goals: Assessment of neighborhood walkability and bikeability
Number of Scoring Criteria: 5 categories, 14 questions (walkability survey)
Tool Format: 1 page
Instruction Format: 3 pages
Evaluation Criteria Examples: Room to walk, cross streets, driver behavior, safety rules, pleasantness
Pros:
- Quick, general glance of a community’s pedestrian environment
- Specific to walking experiences
- Short survey
- Separate bike environment assessment
Cons:
- Mostly subjective questions
- Interpretation of findings could be confusing
- Assessment for overall neighborhood not specific to each segment
Overall:
- Convenient to use
- Mostly qualitative survey
PEDESTRIAN ENVIRONMENT DATA SCAN (PEDS) AUDIT
Author/Organization: Kelley Clifton, Andria Livi, Daniel Rodriguez
Goals: Assessment of neighborhood walkability and streetscapes
Number of Scoring Criteria: 5 categories, 40 questions
Tool Format: 1 page
Instruction Format: 12 pages
Evaluation Criteria Examples: Environment, pedestrian facility, road attributes, walk/bike environment, subjective assessments
Pros:
- Detailed data collection
- Comprehensive survey from number of lanes to street features
- Separate subjective assessment for overall walkability and bikeability
Cons:
- Lots of variables to fill out
- Specific to each segment
- Takes time if area is large and numerous paths exist
- Survey does not accumulate into summed conclusion
- Could be difficult for volunteers to make conclusions
Overall:
- Provides detailed picture of existing environment
- Mostly quantitative survey
CDC BUILT ENVIRONMENT
Author/Organization: Centers for Disease Control (CDC)
Goals: Assessment of streetscapes for all individual segments in an area
Number of Scoring Criteria: 4 sections, 19 sub-categories, 81 questions
Tool Format: 9 pages
Instruction Format: 32 pages
Evaluation Criteria Examples: Pedestrian facility, pedestrian conflict, crosswalks, maintenance, path size, buffer, universal aesthetics, shade
Pros:
- Detailed data collection
- Comprehensive survey from number of lanes to street features
- Specific instructions for coding and data interpretation
Cons:
- Could take much time to conduct on site by volunteers for each segment of the network
Overall:
- Provides detailed picture of existing environment
- Mostly quantitative survey
Overall, the goals of pedestrian audits and walkability evaluations are to help improve, intervene in, or enhance community built environments to provide comfortable, safe, and efficient pedestrian and vehicular environments for people to travel about in their neighborhoods and communities. Collectively, the assessment findings can also improve the community’s perception of their pedestrian environment and improve the overall quality of life.
After using the walkability assessment tools, it is important to analyze and interpret the findings to identify effective evidence to justify decisions related to why, where, what, and how to plan, design, and implement features that will enhance the built environment. Such interpretation can support community decisions to enhance walkable environments for citizens, improve safety, raise comfort levels for all travelers, and provide healthy outdoor activity settings. Also, by assessing the existing conditions, community groups can evaluate the quality of each segment and overall system or network which can lead to providing for more comfort, safety, and aesthetics of the walking environment (Figures 2 and 3).
Figure 2. Walkability assessment of Warsaw, Kentucky, reflecting the range of walkability from Needs Improvement (red) to Good Quality (green) using PBIC’s Walkability Checklist to evaluate the travel experience
Source: Base imagery from USDA FSA NAIP

Figure 3. Walkability assessment of Warsaw, Kentucky, reflecting the range of walkability from Needs Improvement (red, 4) to Good Quality (green, 1) through the subjective assessment of each sidewalk segment within the PEDS audit tool
Source: Base imagery from USDA FSA NAIP

Communities can improve the connectivity of their walkable environment by identifying through assessments potential areas that are missing walkways and sidewalks. After identifying these gaps, communities can be better aware of their disconnected built environment and extend and expand walkable areas through further improvements to their pedestrian networks (Figure 4).
Figure 4. Sidewalk network connectivity assessment of Warsaw, Kentucky, highlighting areas with absent sidewalks (dotted lines)
Source: Base imagery from USDA FSA NAIP

STEP THREE. FURTHER INVENTORY AND ANALYZE OTHER ASPECTS OF YOUR COMMUNITY CONTEXT IN RELATION TO WALKABILITY AND CONNECTIVITY
Inventory of Other Aspects
The inventory phase of a walkability and connectivity project can identify the conditions that influence the walkable environment such as other infrastructure, vegetation, amenities, frequency of foot traffic, people engaged in activities, how interesting corridors are, and what and how spaces are used. Other inventory content should include biological/ physical, social/economic, and historical/ cultural information that will inform community members during the analysis phase of the project on how to effectively interpret and make decisions (Table 3).
Table 3. Further inventory information to support walkability and connectivity community projects
BIOLOGICAL/PHYSICAL
- Routes and conditions of sidewalks and streets
- Pedestrian traffic counts and flows
- Street vegetation location and conditions
- Physical condition and location of public spaces, features, amenities
- Origin and destination points
- Climate and weather conditions
- Types and locations of wayfinding system
SOCIAL/ECONOMIC
- Demographics (population, age, gender, ethnicity, etc.)
- Economic indicators of the community, county, or region
- Planning documents (land use, zoning ordinances, development projects, etc.)
- Regulations, standards for street/road design in cities and counties
- Health indicators (obesity, public health, etc.)
HISTORICAL/CULTURAL
- Historical maps, photos, journals, newspaper articles, etc.
- Community programs, regular or temporary cultural/civic events
- Recreational opportunities
- Landmarks, preserved elements, etc.
- Valued spaces, places, locations
These types of data can be available through government offices (local, regional, state, federal), professional planning/design offices, and individuals from their personal resources. Nowadays, basic information such as maps, aerial imagery, and plan documents may be publicly available on the internet. Ultimately, all of these different types of information will enable working groups to fully interpret, understand, and address the constraints and opportunities for improving and re-envisioning quality walkable environments for communities.
Biological/Physical Information
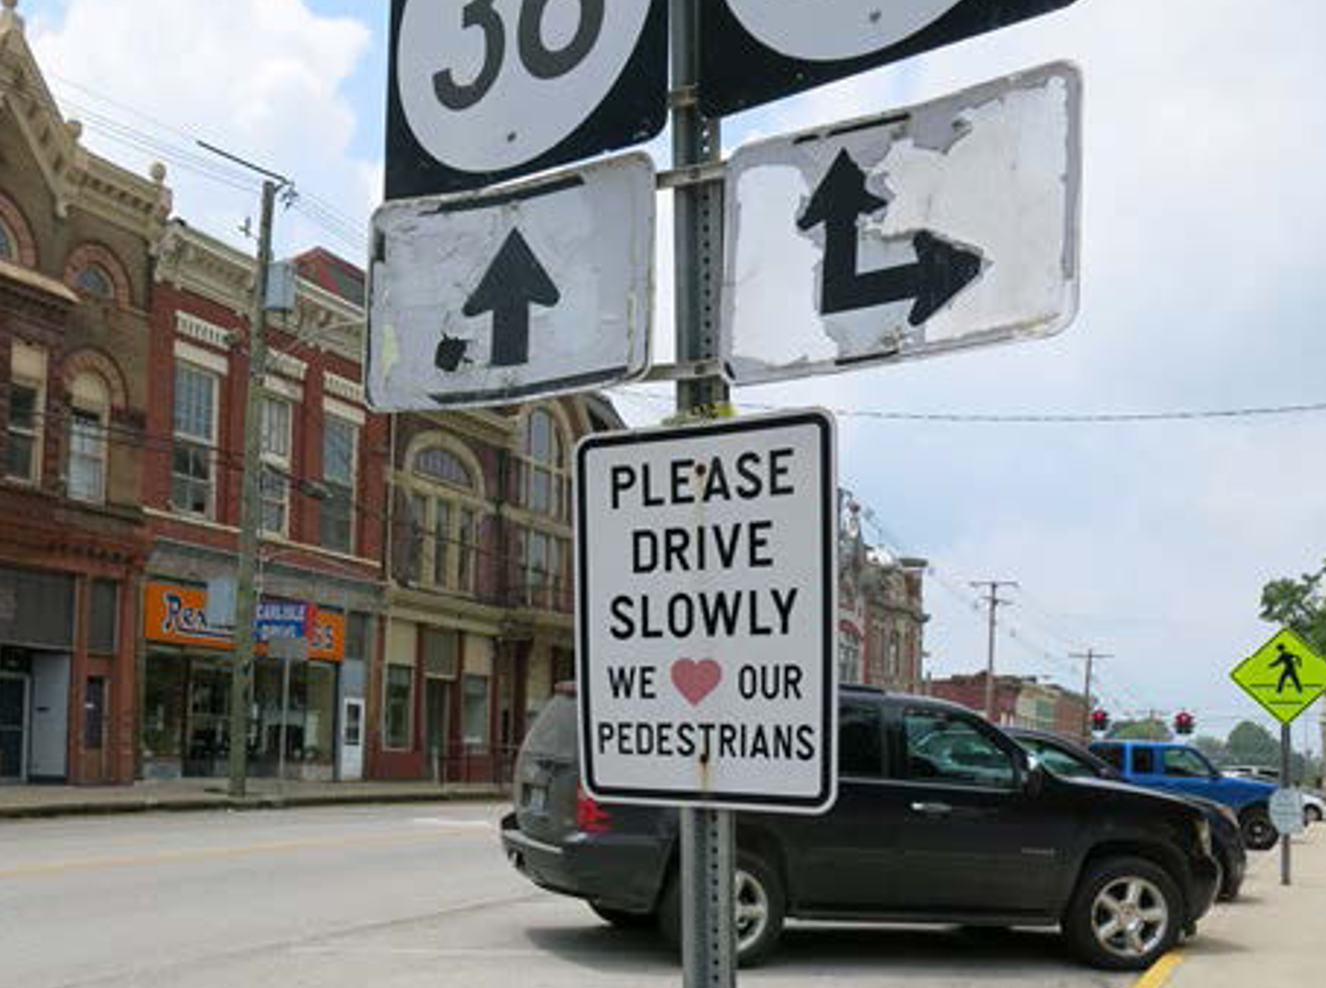
The biological/physical resources and data are important for walkability projects as they inform about the existing conditions of the built environment regarding travel, lifestyle, and activities at larger than a segment scale. Much information on biological/physical resources can be found and collected by utilizing a range of maps, reports, and site visits. The information can assist with the overall planning of potential walkable environments for both short-term and long-term projects. Such information can be retrieved online through information systems such as the Kentucky Geography Network (http://kygeonet. ky.gov/), USGS, The National Mapper, etc. Other information such as potential road/sidewalk projects, economic development projects, public work projects, wayfinding systems, street tree plans, and climate/weather or soil information can be found in reports and documents addressing the physical planning and design of community or economic development proposals (Figure 5).
Figure 5. Sign along East Main Street in Carlisle, Kentucky, supporting the walkable atmosphere by informing drivers about the presence of pedestrians and creating an awareness of safety concerns

SOCIAL/ECONOMIC INFORMATION
Social/economic data presents information about the community changes such as population and economic performances. Examples include demographics, housing units and occupancy, planning documents, and other data that can help strategically plan a community project. Data and information can be found through federal government offices (U.S. Census Bureau, Ag Census); as well as state, regional, and local offices (Area Development Districts, state centers); and community or economic development organizations. These resources may also identify potential funding possibilities that may be available for sidewalks, green infrastructure (planters, street trees, etc.), and Complete Streets or trail enhancement projects, among others (Figure 6).
Figure 6. Housing unit density of Warsaw, Kentucky, illustrating concentration of built structures by block level and existing sidewalks that can inform the existing context of walkability of the community’s built environment
Source: Data from U.S. Census Bureau; Base imagery from USDA FSA NAIP

Members of the community can help find and compile information to address community-wide issues such as health, quality of life, recreation, and community and economic development. This type of information is typically available at the block level or larger scales (block group, tract, district, neighborhood, community, etc.). The social and economic data can help groups understand the larger picture in order to enhance the overall walkable environment.
Historical/Cultural Information
Historical and cultural resources inform working groups about their community’s events, values, treasures, and experiences from the past that may further address and support the needs and visions for the future of a town’s walkable environment. These data help us interpret what mix of social and historical information to reflect in a walkability project while making the experience interesting and useful by identifying origins and destinations. Such information may include historical maps of buildings, corridors, community events, and change of public spaces and their uses over time. Valuable interpretive information can also be gained through personal interviews of those who experienced the historical and/or cultural events.
STEP FOUR. MAP AND PLAN A NETWORK OF CONNECTED PATHWAYS TO IMPROVE YOUR COMMUNITY'S WALKABILITY PROJECT
Community groups can collaboratively work on short-term enhancements with the assessment and analyses information. Members can discuss and map loactions for amenities such as benches for resting or identify locations to fill in missing sidewalk segments. Groups can also envision long-term projects such as developing a network of sidewalks, sidewalk widening, or streetscape corridor projects at the same time or later. Working groups should intentionally connect steps one through three in a coherent and consistent way when structuring an actionable plan. Some groups may plan an effective wayfinding system to direct people to points of interest or destinations where paths are visibly connected and the walkable environment is safe, clean, and pleasant. Other entities may prioritize addressing missing sidewalks by connecting existing segments so that they become a longer route. Still others may work on bicycle and pedestrian plans for their communities to address alternative transportation needs.
STEP FIVE. FIND WAYS TO FUND YOUR PROJECT THROUGH COLLABORATION AND COMMUNITY DISCUSSIONS
Communities can be strategic and plan for accomplishing the overall project by starting with the short-term, quick wins. Although funding infrastructure projects such as walkability can be challenging for many communities, planning ahead is the strategic way to address a community’s needs. With a plan in place, communities will find it easier to apply for funding opportunities when they become available. Communities should continue their efforts to implement a shared, holistic vision or a master plan that addresses multiple community goals and objectives to enhance the quality of life through long-term improvements.
CONCLUSION
Walkability projects provide many benefits to the entire community— from healthier lifestyles to enhanced economic activity. It is important that communities fully interpret and plan for their community’s needs and goals. By collaborating through the prescribed planning and implementation steps and clearly articulating targeted outcomes for a particular project, communities will have a better understanding and vision of their overall potential accomplishments toward building a quality walkable, connected environment.
FURTHER RESOURCES
Pedestrian and Bicycle Information Center http://www.pedbikeinfo.org/
Pedestrian and Bicycle Information Center is funded by the U.S. Department of Transportation, Federal Highway Administration, and is maintained by the University of North Carolina Highway Safety Research Center. The center provides walkability and bike-ability resources including checklists to utilize in analyzing the walkability of a community. The organization aims to improve the quality of life in communities by increasing safe walking and bicycling as a viable means of transportation and physical activity. Their resources can help communities identify issues related to walkability and further guide/direct toward improving specific areas/aspects of their neighborhoods to increase the community’s walkability and bike-ability.
U.S. Department of Transportation, Federal Highway Administration, Office of Planning, Environment, and Realty, Bicycle and Pedestrian Program (US DOT, FHWTO, HEP) https://www.fhwa.dot.gov/environment/bicycle_pedestrian/
The Federal Highway Administration’s Bicycle and Pedestrian Program advocates for quality walking for all abilities and bicycling environments. It provides funding, policy guidance, program management, and resource development for pedestrian and bicycle transportation projects. State bicycle and pedestrian coordinators in each state work as points of contact for allocating funds in their respective states while also working with an FHWA bicycle and pedestrian coordinator in each FHWA division office.
Kentucky Transportation Cabinet (KYTC), Bike Walk http://transportation.ky.gov/bikewalk/
The Kentucky Transportation Cabinet (KYTC) distributes and implements federal transportation funds allocated for the state. The KYTC distributes and manages funds and grants to raise awareness of bicycle and pedestrian safety throughout Kentucky’s towns and schools to encourage walking and/or biking to school and work by constructing safer routes. Also, the office awards training opportunities and funds to help communities improve and plan for the cultural, aesthetic, historic, and environmental aspects of local transportation infrastructure.
REFERENCES
Clifton, K., A. Livi, and D. Rodriguez (2004). Environmental Audits [Pedestrian Environment Data Scan (PEDS) Tool]. http://planningandactivity.unc.edu/RP1.htm
Centers for Disease Control and Prevention (CDC) (2015). The Built Environment: An Assessment Tool and Manual. https://www.cdc.gov/nccdphp/dch/built-environmentassessment/index.htm
Pedestrian and Bicycle Information Center (n.d.). Walkability Checklist: How Walkable is your Community? http://www.pedbikeinfo.org/cms/downloads/walkability_checklist.pdf
U.S. Census Bureau (2013). Census 2010. ftp://ftp.kymartian.ky.gov/census/cenblock2010.zip
USDA FSA National Agriculture Imagery Program (NAIP). (2015). Kentucky Statewide 1 Meter Aerial Imagery (2014) - KY1Z. ftp://ftp.kymartian.ky.gov/FSA_NAIP_2014_1M/
Download Formatted Publication
Related Information